The Flow of Dunning Kruger – a Blend of Challenge, Skill and Perception

I’ve discussed Dunning Kruger syndrome a number of times, loving the phrase “Peak of Mount Stupid” which we’ve all been on at some point.
Flow
A few months ago, I was introduced to Flow by Mihaly Csikszentmihalyi, described succinctly by Chris Bailey.
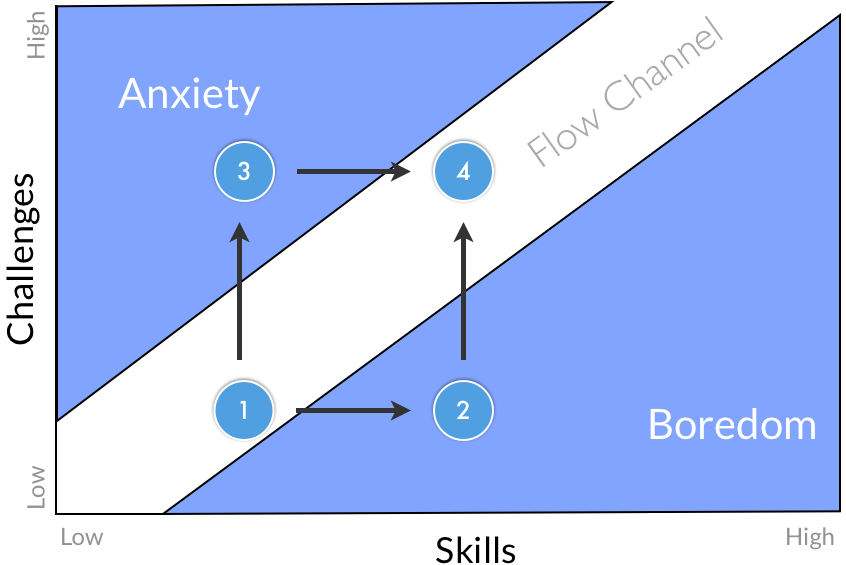
Borrowing Chris’ interpretation of a core chart from the book, we can see that the challenge has to be appropriate to the skill level achieved. Not enough challenge induces boredom, too much of a challenge induces anxiety.

Skill Perception
You may have heard of the Imposter Syndrome, partly known as the Dunning-Kruger Effect. It’s when a person, newly learning a set of skills, believe that they know more than they do or are more capable than they are. Perversely, someone more experienced may view themselves as less capable because they know more of what they don’t know.
There is a spike near the beginning where the perceived skill is vastly greater than the person’s actual skill. Then the perception dips as reality kicks in, with the student learning more about their abilities and what they can’t do. At this stage, they’re likely to underestimate what they can do. Gradually the perceived skill and the actual skill merge.
Note that the horizontal axis show time, but it’s time applied to learning and experiencing the skill. Time alone doesn’t change the level of the skill.

Blending It Together
I’ve taken the chart above and applied a simple change; I’ve added a series for Challenge. I originally had several level of challenges, so that we could see the difference between a challenge that is too easy (hence inducing boredom) and a challenge that is too hard (hence inducing anxiety), but found that the chart was too cluttered for the message.
So I chose a typical motivating level of challenge, where the target is just outside of your grasp, but you can see how you’d get there with support and practice.
I’ve applied it as a function of the actual skill, so naturally, it falls above the actual skill, creating that stretch target.

The interesting part for me is where the perceived skill is higher than the challenge. In this case, the person is likely to be bored, but since their actual skill is below the level required for the challenge, they’re likely to fail if they apply themselves to the challenge. So we end up with typical responses:
“That’s beneath me”, “why would I want to do that?”, “I’m better than that”
Essentially avoiding the task (including the inherent challenge and the opportunity to improve). We see this response as a shortcut to avoiding the responsibility of having to put the hard-work in to learn.
A worse response still is the one where the challenge is dutifully accepted, but done a completely different way to the industry-standard without reference to safety, risk, etc. I’m not saying that fresh eyes are wrong, but we should blend our new ideas with the current operating environment.
Following the fall from the Peak of Mount Stupid (you can guess where that is on the chart), we see the pit of despair. During that trough, it may make sense to relate the challenges relative to the perceived skill rather than the actual skill. In the chart, I’ve kept the challenges proportional to the actual skill. It’s easy to imagine a possibly better situation for challenges being aligned with the dip, but keeping above it so as to introduce some reality to the student (i.e. showing them that they are better at it than they think they are).


Recent Comments